
You shouldn't think of a marketing report as just a simple document, instead it’s a tool that marketers can use to tell the story behind their data. The goal of any data-driven marketing report should be to help businesses track performance and make informed decisions that can improve future campaigns.
But not all marketing reports are created equal.
Some provide clear, actionable insights, while others are just a jumble of numbers with no real direction.
So, how do you create marketing reports that actually add value?
In this guide, we will show you how you can create the best marketing reports for your business, you will learn about the different types of marketing reports, and what mistakes to avoid when creating them.
We also spoke to some digital marketers from leading agencies around the world to get their insights on what to include in your marketing reports.
I’d like to thank the following people for giving their insights and adding their contributions:
- Dave Reeder, Founding Director of Made Simple Media, London, United Kingdom
- Isaac Bullen, Director at 3WH, London, United Kingdom
- Paul DeMott, Chief Technology Officer of Helium SEO, Ohio, United States
- Marc Hardgrove, CEO of The HOTH, Florida, United States
What is a Marketing Report?
A marketing report is a document that analyzes key marketing metrics, campaign performance, and overall strategy effectiveness.
Depending on the type, a marketing report can cover website traffic, social media engagement, lead generation, ad performance, and more.
The goal behind any marketing report is to translate raw data into actionable recommendations that improve marketing outcomes.
What are the Different Types of Marketing Reports?
Marketing reports come in various shapes and sizes, each serving a unique purpose. Here are some of the most common types:
- Performance Reports: Track key metrics like website traffic, conversions, and ROI to measure the success of marketing efforts.
- SEO Reports: Analyze organic traffic, keyword rankings, backlinks, and technical SEO factors to assess search engine performance.
- Social Media Reports: Measure engagement, follower growth, reach, and ad performance across social media platforms.
- PPC Reports: Provide insights into paid advertising campaigns, including click-through rates (CTR), cost per acquisition (CPA), and return on ad spend (ROAS).
- Email Marketing Reports: Show open rates, click-through rates, conversions, and subscriber growth for email campaigns.
- Content Marketing Reports: Evaluate blog performance, engagement metrics, and lead generation from content efforts.
- Competitor Analysis Reports: Compare your marketing performance against competitors to identify strengths, weaknesses, and opportunities.
- Customer Insights Reports: Analyze audience demographics, behavior, and feedback to better understand your target market.
What to Put in a Marketing Report?
Goals
Every marketing report should start with clear goals. These define what you’re trying to achieve and set the foundation for measuring success.
Without goals, the data in your report lacks context, making it difficult to determine whether your efforts are paying off.
Your goals should align with your overall marketing strategy and business objectives.
For example, if your goal is to increase website traffic, your report should focus on metrics like organic sessions, referral traffic, and page views.
If you're running a paid ad campaign, your goal might be to generate leads, and your report should highlight cost per lead (CPL), conversion rates, and return on ad spend (ROAS).
Clearly outlining goals at the beginning of your marketing report helps stakeholders understand the purpose behind the data and ensures everyone is on the same page when evaluating performance.
Website Analytics
Analytics form the core of any marketing report, providing the data needed to measure performance and make informed decisions.
Depending on the type of marketing report, analytics can cover different areas:
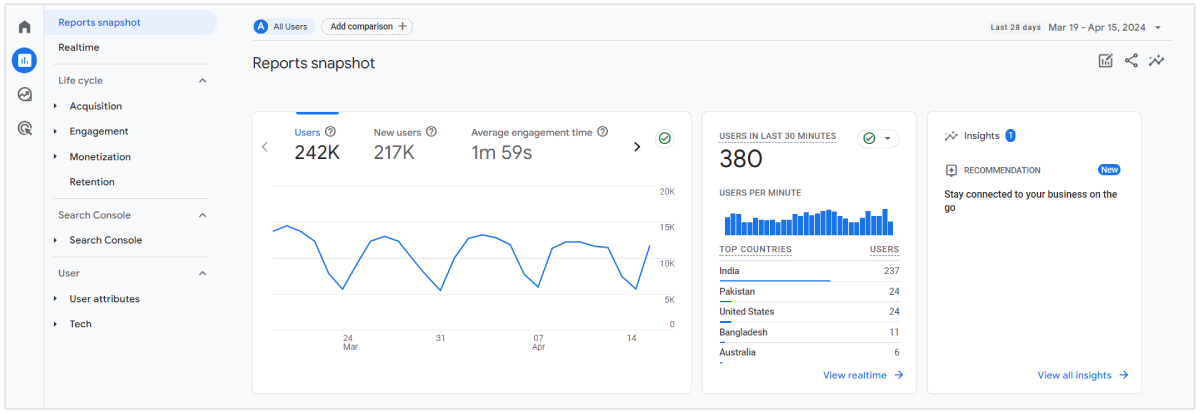
- Website Analytics: Track traffic, bounce rates, page views, and user behavior to understand how visitors interact with your site. Google Analytics will probably be your go-to solution for reporting on website analytics.
- SEO Analytics: Measure keyword rankings, organic traffic, backlinks, and domain authority to assess search engine performance.
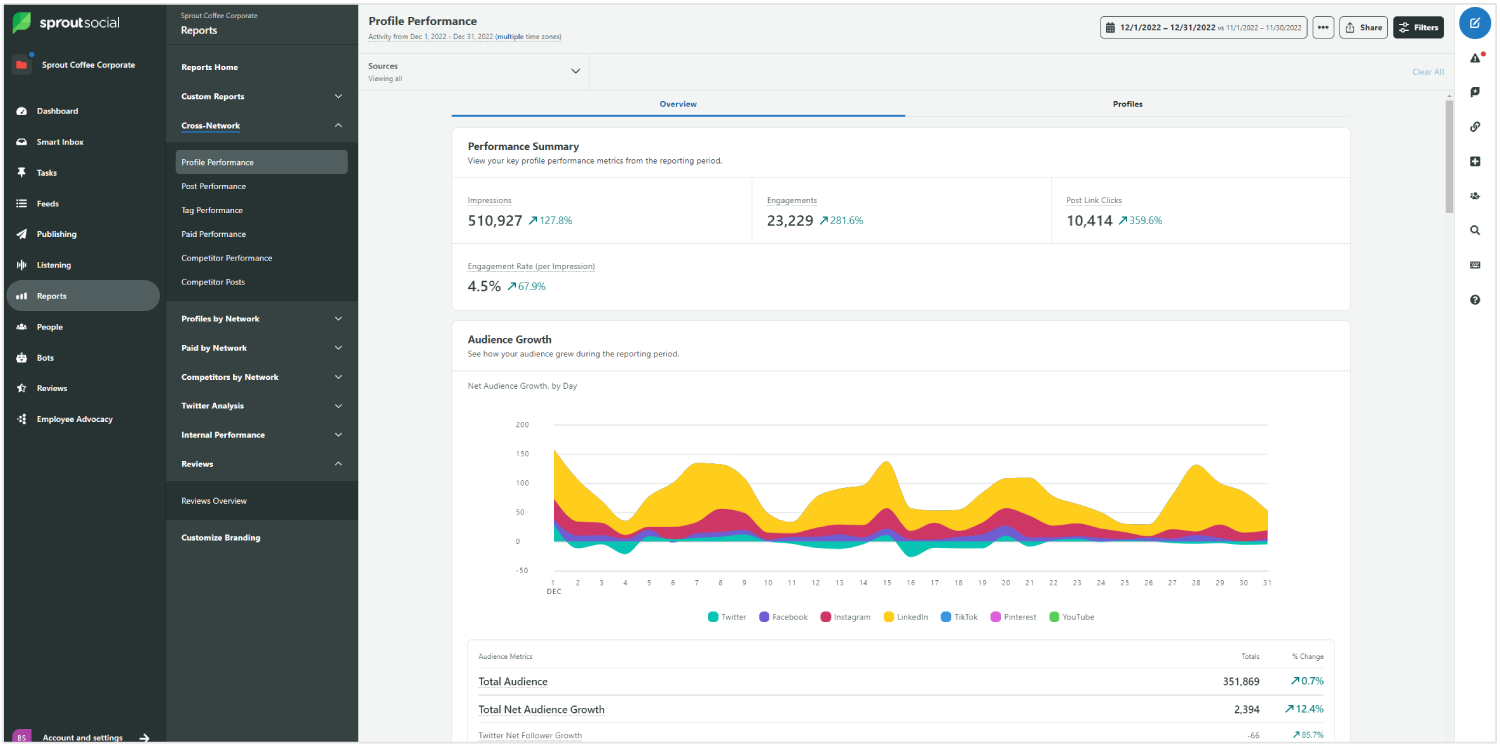
- Social Media Analytics: Analyze engagement, follower growth, impressions, and reach across platforms like Facebook, Instagram, LinkedIn, and Twitter. Each of these platforms have their own analytics reports, however, if you want a consolidated dashboard of all your social media profiles you'll need a third-party app or tool like SproutSocial or SocialStatus.
- PPC Analytics: Evaluate ad spend, click-through rates (CTR), cost per acquisition (CPA), and conversion rates to determine the effectiveness of paid campaigns.
- Email Marketing Analytics: Monitor open rates, click-through rates (CTR), unsubscribe rates, and conversions to gauge email campaign success.
Including relevant analytics in your marketing report allows you to track progress, identify trends, and spot areas for improvement.
It also helps stakeholders see the impact of your marketing efforts with clear, data-driven insights.
Leads and Customers Gained
One of the most critical elements of a marketing report is tracking how many leads and customers your efforts have generated.
After all, marketing isn’t just about traffic and engagement, but it’s also about driving real business results.
Your report should highlight:
- New Leads: The number of potential customers who have shown interest in your business (e.g., email sign-ups, form submissions, or demo requests).
- Lead Conversion Rate: The percentage of leads that turned into paying customers.
- New Customers Acquired: The total number of new customers gained through marketing efforts.
- Customer Acquisition Cost (CAC): The cost of acquiring each new customer through paid and organic channels.
Breakdown of the Data
Raw data alone isn’t enough, your marketing report should include a clear explanation of what the numbers mean.
Data without context can be confusing, especially for stakeholders who aren’t deeply involved in marketing analytics.
When explaining the data, consider the following:
- Key Takeaways: Summarize the most important insights from the data. For example, if website traffic increased by 20%, explain what caused the spike (e.g., a successful campaign, improved SEO, or a viral social media post).
- Trends and Patterns: Identify recurring trends, such as seasonal fluctuations in engagement or a steady increase in conversions over time.
- Comparisons: Compare performance to previous periods to show progress.
- Possible Causes: Provide explanations for any significant changes. If conversions dropped, was it due to a budget decrease, Google algorithm updates, or audience shifts?
- Actionable Insights: Suggest what steps should be taken next. For example, if social media engagement is low, you might recommend testing new content formats or increasing ad spend.
A well-explained marketing report ensures that stakeholders not only see the data but also understand its impact and how to use it to improve future marketing efforts.
What Not to Include in a Marketing Report
A marketing report should be clear, concise, and focused on insights that matter.
Including too much unnecessary information can overwhelm stakeholders and dilute the key takeaways.
Instead of adding every possible metric or detail, your report should highlight the most relevant data that aligns with your goals.
Marketing Jargon
Marketing reports should be easy to understand, even for stakeholders who aren’t marketing experts.
Using too much industry jargon can make your report confusing and less impactful.
Instead of complex terms like “CTR optimization through bid adjustments” or “SERP volatility impact on organic acquisition”, use simple, clear language.
Marketing jargon is the quickest way to turn a client off reading your report, meaning you have wasted your time writing it and crucially they may not fully action or buy into your marketing strategies moving forward.
Put it in terms they will understand.
- Dave Reeder, Founding Director of Made Simple Media
If technical terms are necessary, provide a brief explanation of such terms.
The goal is to ensure that anyone reading the report, whether it’s a CEO, sales manager, or client, can quickly grasp the key takeaways without needing a marketing dictionary.
Irrelevant and Vain Metrics
Not all metrics are valuable. Including irrelevant or vanity metrics can make your report unnecessarily long and misleading.
For example:
- Total social media followers might seem impressive, but if engagement is low, it doesn’t mean much.
- Page views without context don’t tell you if visitors are actually converting.
- Email open rates are useful, but without click-through rates and conversions, they don’t show real impact.
Focus on metrics that align with your goals and directly impact business growth, such as conversions, customer acquisition costs, and return on investment (ROI).
A lean, insight-driven report is always more effective than a bloated one full of vanity numbers.
Overly Detailed Raw Data
On the flip side, you don't want to include too much data in your marketing reports.
While data is important, including every single data point can be overwhelming to the reader.
Instead of listing every click, impression, or engagement metric, focus on summarizing trends and key performance indicators (KPIs).
I'd be cautious about overcomplicating your marketing reports, keep them top-level - showing the overall performance. Drilling down too much or providing too many pages turns people off.
We practiced this on a few of our clients, providing a longer report one month and tracking page interactions, people don't tend to get past 5 pages. The first page is the most important, make it count.
- Isaac Bullen, Director at 3WH
You can use visuals like graphs and tables to highlight the most critical information and to make it easier to understand. (more on that later)
How Often Should You Create a Marketing Report?
The frequency of your marketing reports depends on your goals, campaigns, and stakeholders’ needs.
Here’s a general guideline that you can follow:
- Weekly Reports: Useful for tracking short-term campaigns, social media performance, and ad spend adjustments.
- Monthly Reports: Ideal for measuring overall marketing performance, identifying trends, and making data-driven decisions.
- Quarterly Reports: Best for high-level strategic analysis, reviewing key performance indicators (KPIs), and planning future marketing efforts.
- Annual Reports: Provide a big-picture view of marketing success, long-term trends, and ROI analysis.
Most of the experts that we spoke to said that monthly reports are ideal.
I generally create marketing reports monthly.
This timeframe allows enough data to accumulate to show meaningful trends and it keeps clients informed without overwhelming them with information.
- Paul DeMott, Chief Technology Officer of Helium SEO
But Paul also notes that they will adjust reporting timeframes based on the client’s needs and the specific campaign.
For instance, I like to report more frequently to ensure we're optimizing performance quickly when kicking off a new Google Ads campaign.
What Makes a Good Marketing Report?
Visual Elements
A good marketing report isn’t just packed with numbers, instead it presents data in a way that’s easy to understand.
Visual elements like charts, graphs, and tables help simplify complex information, making it more digestible for stakeholders.
Visuals help non-marketers understand the impact of marketing efforts without needing deep analytical skills.
Instead of sifting through walls of text, decision-makers can quickly grasp trends, comparisons, and performance insights at a glance.
Typically, we design our marketing reports around key performance metrics—such as leads, conversions, organic traffic, and social media engagement—and they MUST be shown through visuals and charts.
This helps clients who aren’t well-versed in the technicalities of marketing reports, as it provides a clear picture of what’s going on.
- Marc Hardgrove, CEO of The HOTH
Here are some examples of visuals that you should add to your marketing reports:
- Bar charts: Compare performance metrics, such as social media engagement across platforms.
- Line graphs: Show trends over time, like traffic growth or conversion rates.
- Pie charts: Display percentage breakdowns, such as the share of traffic from different sources.
- Tables: Organize data for easy reference, like campaign results or ad spend comparisons.
- Heatmaps: Visualize user behavior on a website, showing where people click the most.
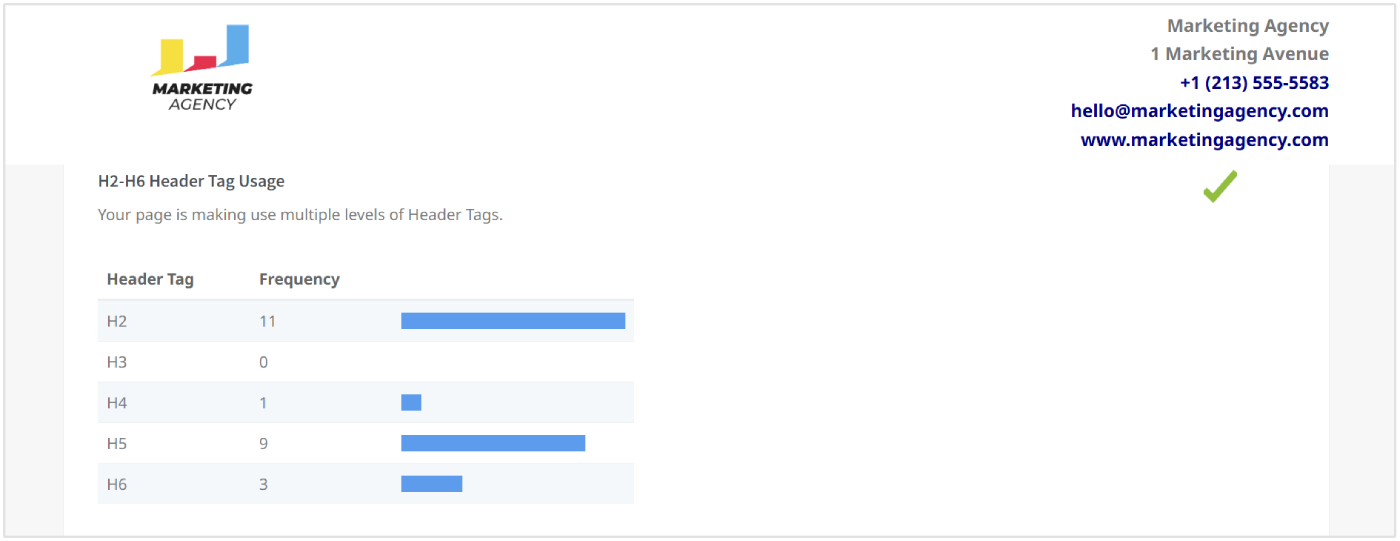
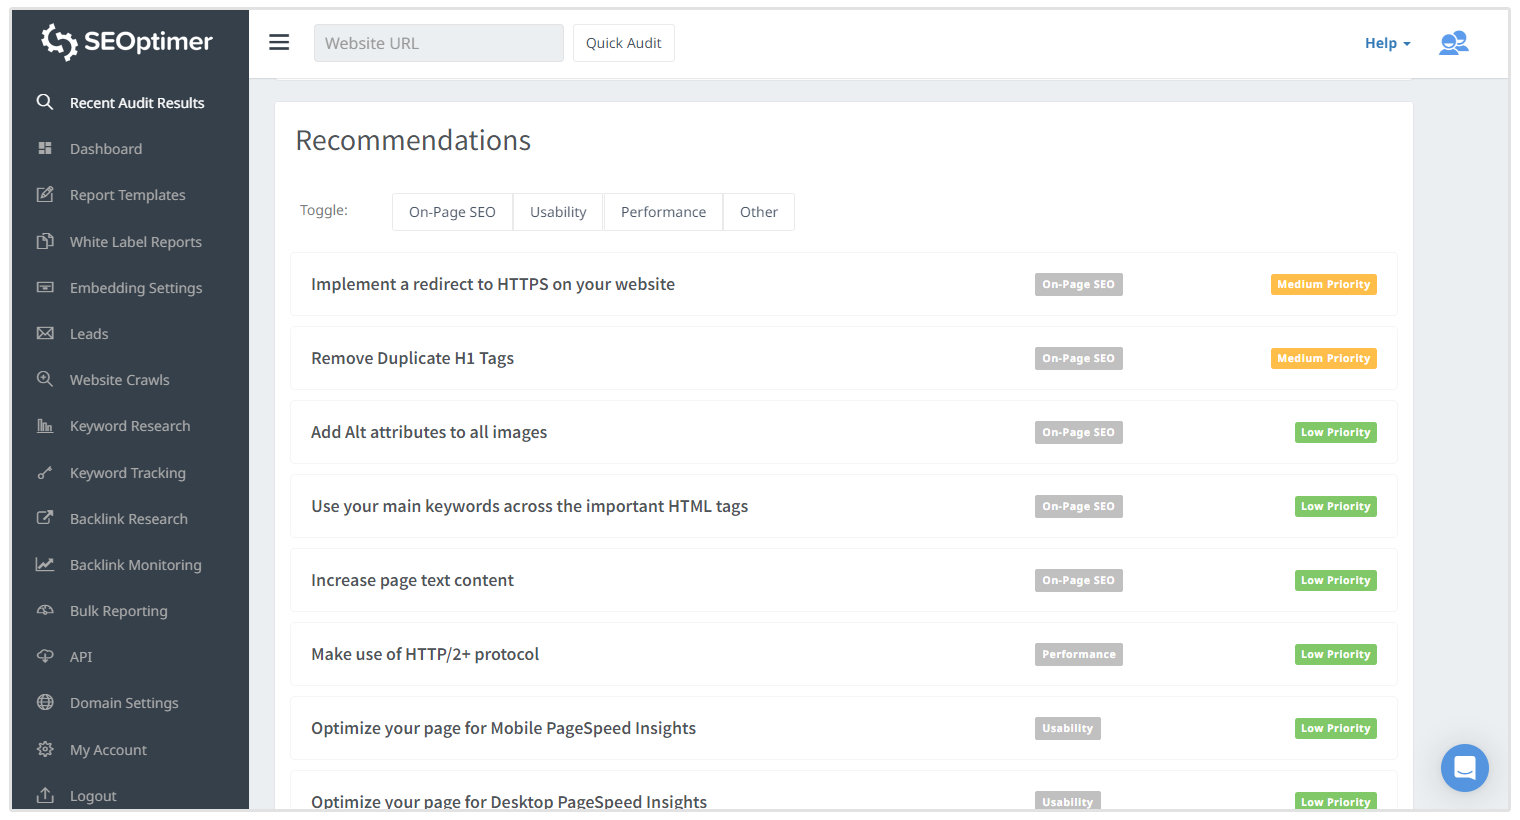
Each of the SEO reports that you create with SEOptimer includes different types of visual elements like tables, pie charts, etc. Below is an example of one of the sections of the report showing header tag usage using a table:
By incorporating these visual elements, your marketing report will be clearer, more engaging, and more actionable for your audience.
Gives Insights for the Future
A great marketing report doesn’t just summarize past performance, but it should also provide valuable insights that help shape future strategies.
Data alone has little impact if it isn’t analyzed and applied to decision-making.
By identifying trends, spotting opportunities, and making recommendations, a report becomes a forward-looking tool rather than just a retrospective summary.
For example, if a Google PPC campaign underperformed, the report should explain why and suggest adjustments to improve future results.
Similarly, if certain strategies proved successful, the report should highlight them so they can be scaled up.
Understanding which channels drive the highest ROI allows businesses to optimize their marketing spend and allocate resources more effectively.
Is Logically Organized
A good marketing report follows a clear, logical structure, making it easy for readers to navigate and extract key insights.
So how do you structure a marketing report in a logical manner?
- Introduction: Briefly summarize the report’s purpose and key objectives.
- Goals & KPIs: Define what was measured and why.
- Performance Data & Analysis: Present key metrics and trends with visual elements.
- Insights & Explanations: Explain the meaning behind the data and any notable trends.
- Recommendations & Next Steps: Provide data-driven suggestions for improvement.
- Conclusion: Summarize key findings and takeaways.
Want to create completely customizable SEO reports and audits for any website?
With SEOptimer, you can create beautiful SEO marketing reports using our White Label Reports feature.
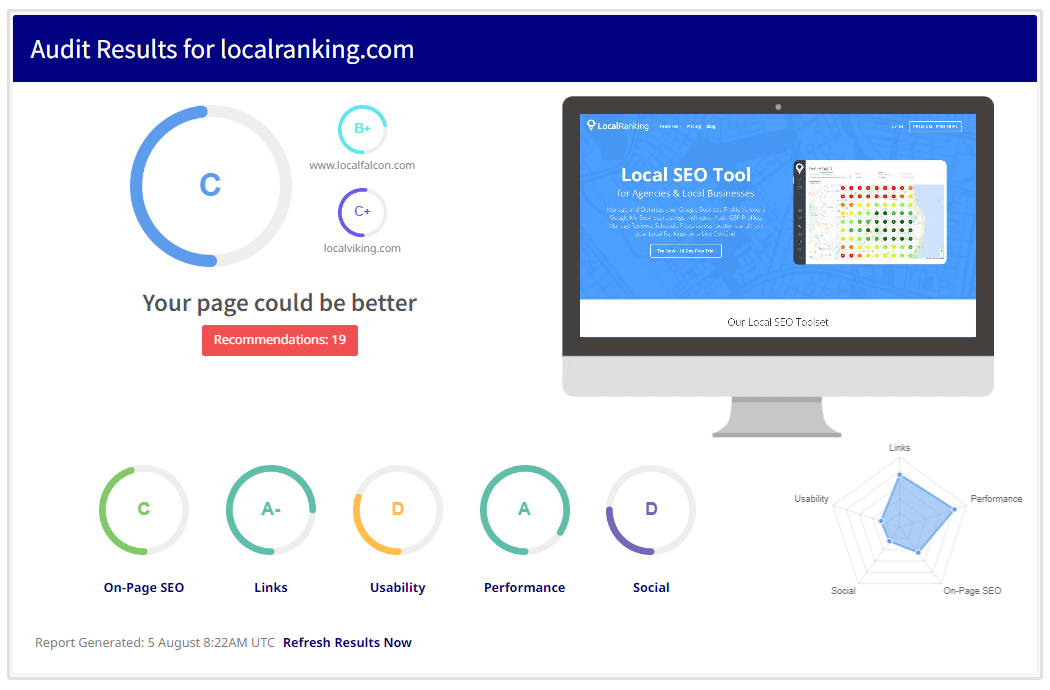
You can add elements such as your business logo, name, address, and other relevant information.
Our unique Javascript rendering technology runs more than 100 important SEO checks on your website and gives useful recommendations on how you can improve your website and rankings.
Wrapping Up
Marketing reports can be used as a strategic tool that helps businesses measure success, optimize campaigns, and plan for the future.
By including essential elements like goals, analytics, leads gained, and clear data explanations, you ensure that your report provides meaningful insights.